

Have you ever heard a FHIR team defend a median latency number while clinicians in the same room complain that the app hangs? The two statements are compatible. p50 tells you what the average request looked like; p99 tells you what the last percent of your users actually experienced. Deployments that report only the median leave the tail unowned.
The gap between the two numbers is where user trust erodes. For related digital-health mechanics, the US digital health hub is the collection on the home page.
What the Two Percentiles Really Measure
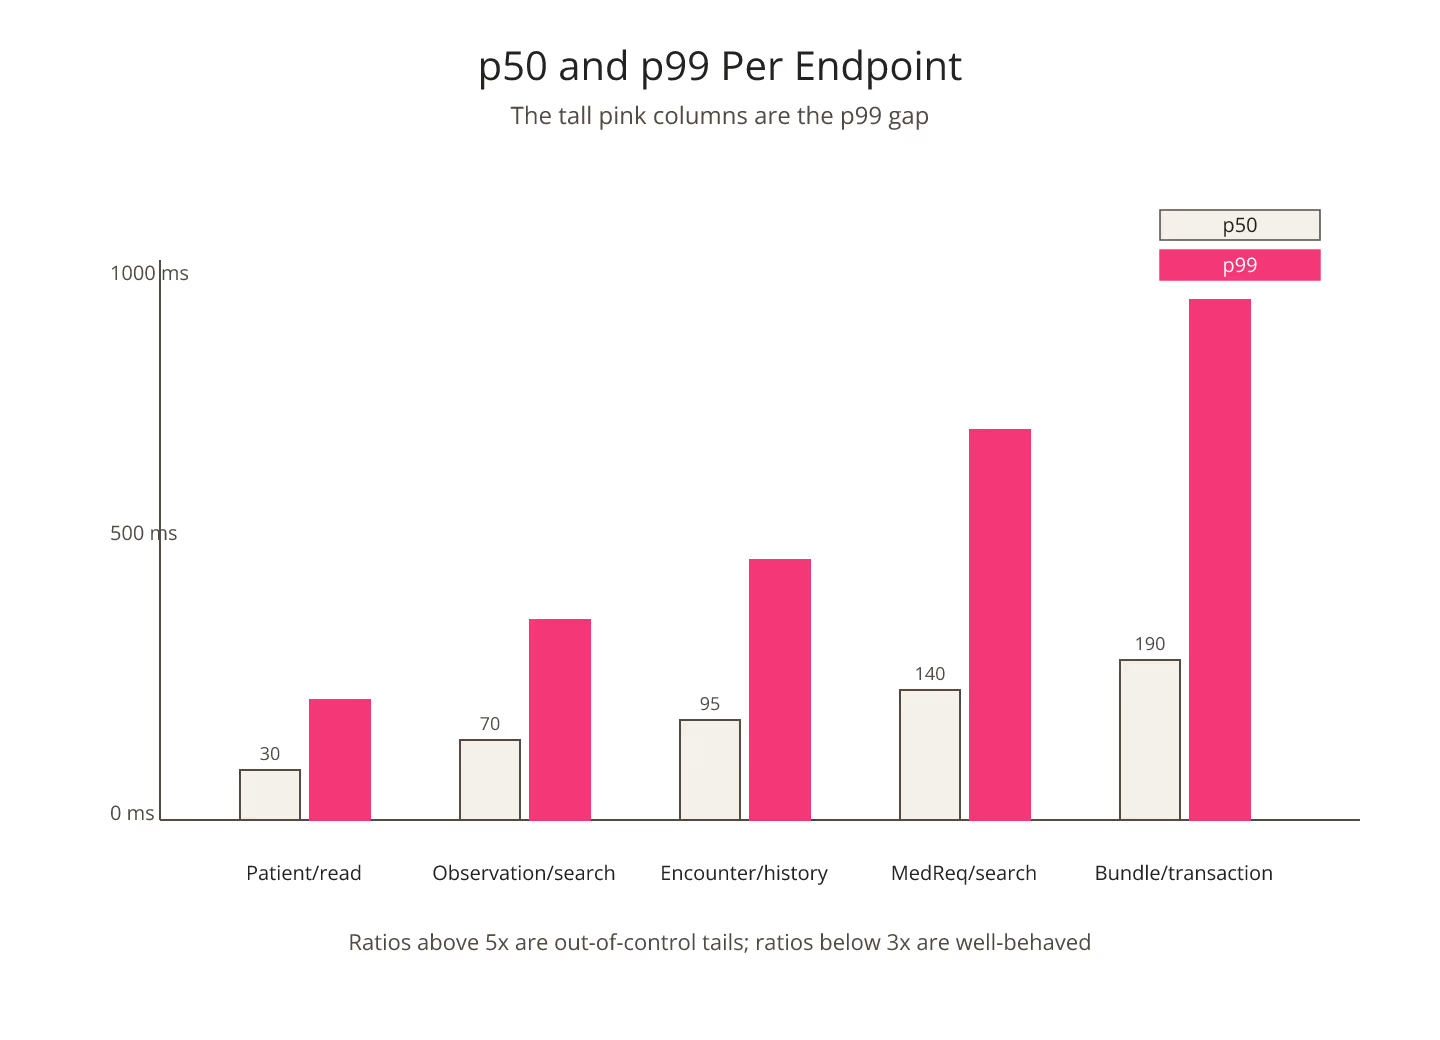
The p50 latency is the value at which half of requests were faster and half were slower. The p99 latency is the value at which ninety-nine percent were faster. In a well-tuned FHIR API those two numbers are close together; in a poorly tuned one they are separated by an order of magnitude.
The gap grows for three reasons: cold caches, expensive query paths, and contended locks. Each of them looks fine at p50 and screams at p99. A pass through the site's FHIR p99 latency lookup is a fast way to check the tail for a given engine and call category before you make claims about it.
Users Feel the Tail, Not the Median
Here is the thing: no user experiences p50 as an isolated event. They experience their next request, and their next, and their next. Over a busy hour a single user fires dozens of requests, and the probability that at least one of them lands in the tail is much higher than the p99 number suggests in isolation.
The math is uncomfortable. If p99 is one second and a user fires two hundred requests in an hour, the expected number of one-second responses that user sees is two. Two hangs an hour is not a metric the user will forgive. For the reader-side view of how this lands, measuring FHIR latency the way clinicians actually perceive it covers the perception model.
The Trap of Improving p50 While p99 Grows
Optimizations that speed up the median case can widen the tail. Adding a cache to the read path improves p50 by ten milliseconds, and if the cache misses expensively it adds fifty milliseconds to p99. The average number looks better; the experience gets worse.
Every optimization should be measured against p50 and p99 together. Deployments that skip the tail check ship regressions on a regular schedule.
Where the Tail Actually Comes From
The most common sources of tail latency in FHIR APIs are:
- Cold cache misses on reference data (CodeSystems, ValueSets).
- Search queries with wide date ranges that fall through the index.
- Bundle transactions whose lock scope collides with another writer.
- Downstream terminology server calls that block on their own tail.
Each source has a fix. None of them are visible in p50 numbers. For the network vs server split of the tail, network latency vs server latency in FHIR requests covers the diagnostic method.
Reporting the Gap Explicitly
The single change that shifts the conversation is to report p50 and p99 together, always. A dashboard that shows only the median makes the tail invisible; a dashboard that shows both makes it a first-class metric.
The ratio between the two is also worth naming. When p99 is more than five times p50, the tail is out of control. When it is under three times, the deployment is well-behaved. Anywhere in between is a warning that grows into a problem as traffic scales.
Owning the Tail
The truth is that FHIR user experience lives in the tail. Deployments that own the p99 number as a first-class concern converge on stable performance; deployments that defend only the median discover the tail through user complaints. Naming the gap is the first move toward owning it.
Sources
- Google SRE Workbook chapter on implementing SLOs - Google SRE Workbook chapter on implementing SLOs, canonical reference on tail percentiles and their user impact