

Have you ever seen a FHIR API dashboard reporting sixty-millisecond response times while your users on the other side of the country still find the app slow? The number on the dashboard is accurate; it just measures the wrong end of the round trip. Every FHIR request carries a network cost that a server-side dashboard does not see, and the split matters for deciding where to spend engineering effort.
The habit that resolves the confusion is to measure both sides separately. For related walkthroughs, the FHIR learning path is the collection on the home page.
What the Server-Side Dashboard Measures
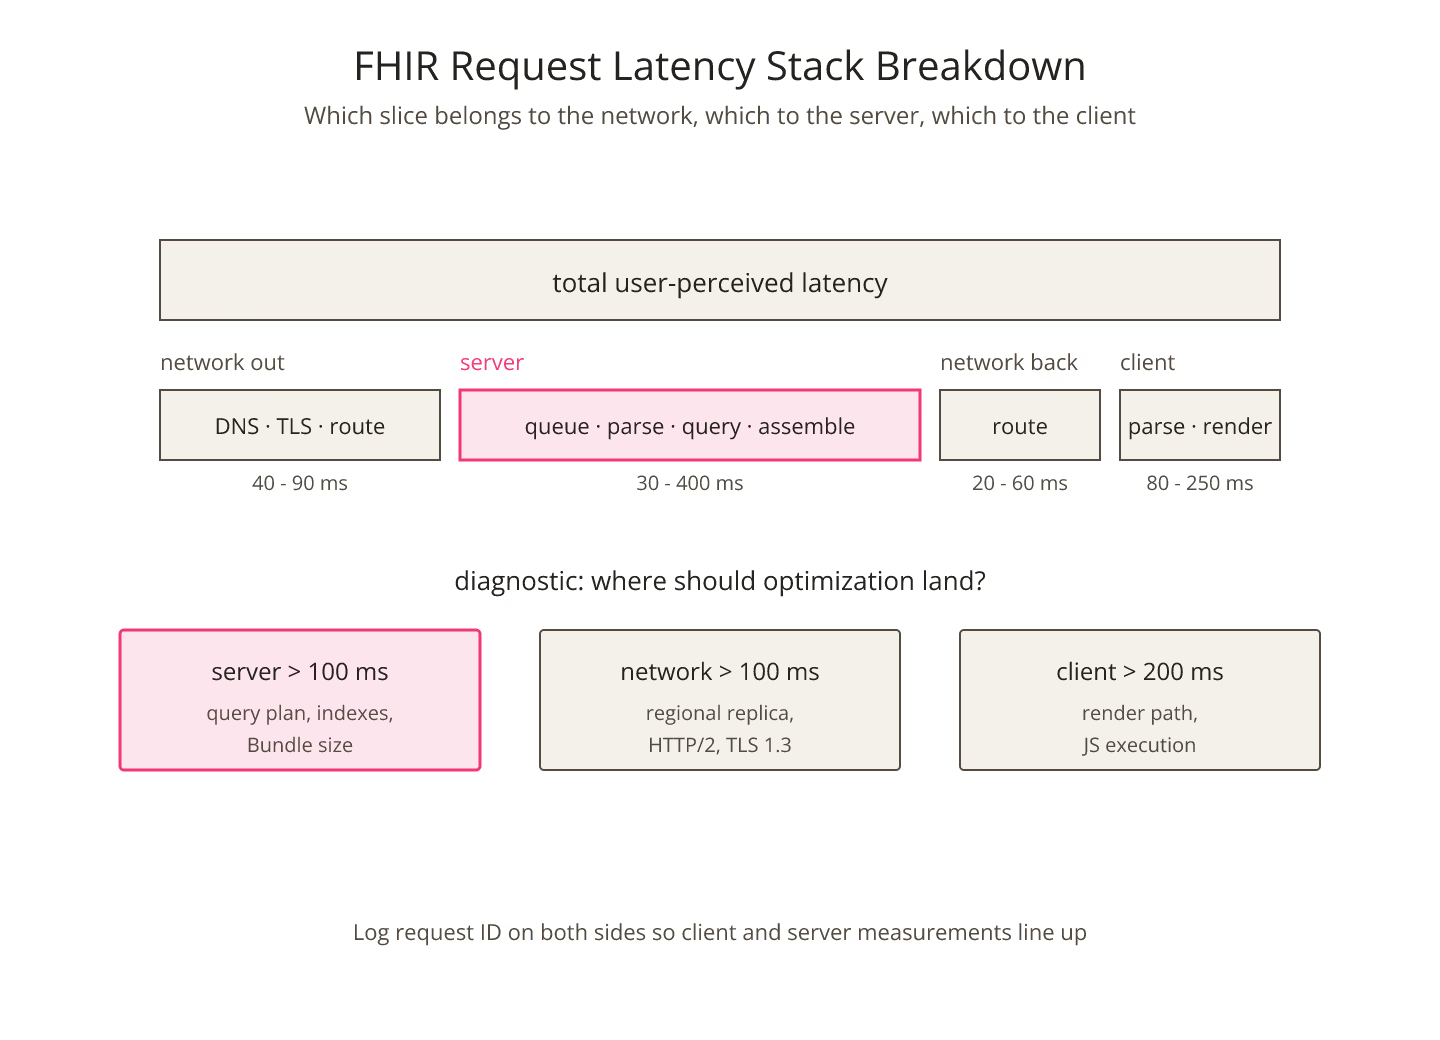
Server-side latency is the interval from the moment the request arrives at the FHIR server to the moment the response leaves it. That interval covers request parsing, authentication, database work, response assembly, and serialization. It does not cover anything that happened on the wire.
Server-side dashboards are useful because they are the layer you can optimize directly. The mistake is treating them as if they described the user experience. They describe a fraction of it.
What the Network Adds
Network latency is the sum of the DNS lookup, TLS handshake, request travel time, and response travel time. For a user near the data center that sum is a few milliseconds. For a user across the country it is fifty to seventy milliseconds even under perfect conditions.
A FHIR request that spends sixty milliseconds on the server and sixty milliseconds on the network arrives at the user in a hundred twenty milliseconds. The dashboard shows sixty; the user sees a hundred twenty. A pass through the site's FHIR p99 latency lookup brackets the server-side figure so you can subtract it out and see the network number.
Diagnosing the Split
The single move that untangles the split is to log both the server-side timing and the client-side timing on the same request. A request ID that appears in both logs lets you compute:
- Client-side total = network + server + client rendering.
- Server-side reported = server only.
- Network + rendering = client-side total minus server-side reported.
The last number is the one that says whether the user's slowness is on the wire or on the render path.
When to Optimize Which Side
Optimizing the server is what most teams do first because it is the layer they own. The truth is that once the server-side p99 is under a hundred milliseconds, further server work usually returns less than an equivalent investment in network positioning or client-side rendering.
Moving the FHIR server closer to the users through regional replicas often produces bigger perceived-latency wins than shaving another twenty milliseconds off the query path. For cache-side interactions with the same split, when caching hides FHIR latency until the cache expires covers the cases where the two overlap.
The TLS Handshake Deserves Its Own Line
The TLS handshake alone can add fifty to two hundred milliseconds on a cold connection. Connection pooling, HTTP/2 keep-alive, and TLS 1.3 fast-open all reduce that cost, but only if the client actually opens them. Mobile apps that spawn a fresh connection per request pay the full handshake cost every time.
Reporting handshake time separately makes the cost visible. Reports that lump handshake into total network latency mask it entirely.
Query Complexity Owns the Server Side
On the server side the largest contributor to latency variance is query complexity. Search parameter combinations, _include expansions, and wide date ranges each push the query further into the index and back. For the specific parameter-combination surface, search parameter combinations that surprise you at scale walks through the traps.
Naming the network and server splits separately is the shortest path to spending optimization effort where the payback actually lives.
Sources
- HL7 FHIR core specification of HTTP interactions defining - HL7 FHIR core specification of HTTP interactions defining the server side of the round-trip latency stack