
Have you ever watched a team draft a beautiful latency SLO document, ship it to production, and then quietly ignore it three weeks later? SLOs get ignored when they were written for a version of the system that no longer exists, or when their alerting drives operations toward decisions the organization is unwilling to make. The SLOs that survive are the ones written with production behavior in mind from the start.
The trick is to design the SLO for the real workload. For related walkthroughs, the FHIR knowledge collection is the collection on the home page.
The SLO Number Should Match What You Can Defend
A latency SLO says the ninety-fifth percentile response time will be under three hundred milliseconds ninety-nine percent of the time. Every clause in that sentence should be defensible from real measurements.
Numbers pulled from a slide deck without production data behind them tend to hold for a month and then drift. A pass through the site's FHIR p99 latency lookup gives a defensible baseline for the tail per engine and per call category.
Choose the Percentile That Matches the User Impact
The SLO percentile should match how the user experiences the system. p95 works for internal tooling where an occasional slow request is tolerable. p99 works for interactive clinical workflows where any slow request degrades trust. p99.9 works for critical paths where users hang up on failure.
Picking the percentile too low leaves the tail unmanaged. Picking it too high makes the SLO impossible to honor at the traffic volumes you actually run. For the underlying gap, the p50 vs p99 gap that kills FHIR user experience covers the reasoning.
Split the SLO by Workflow
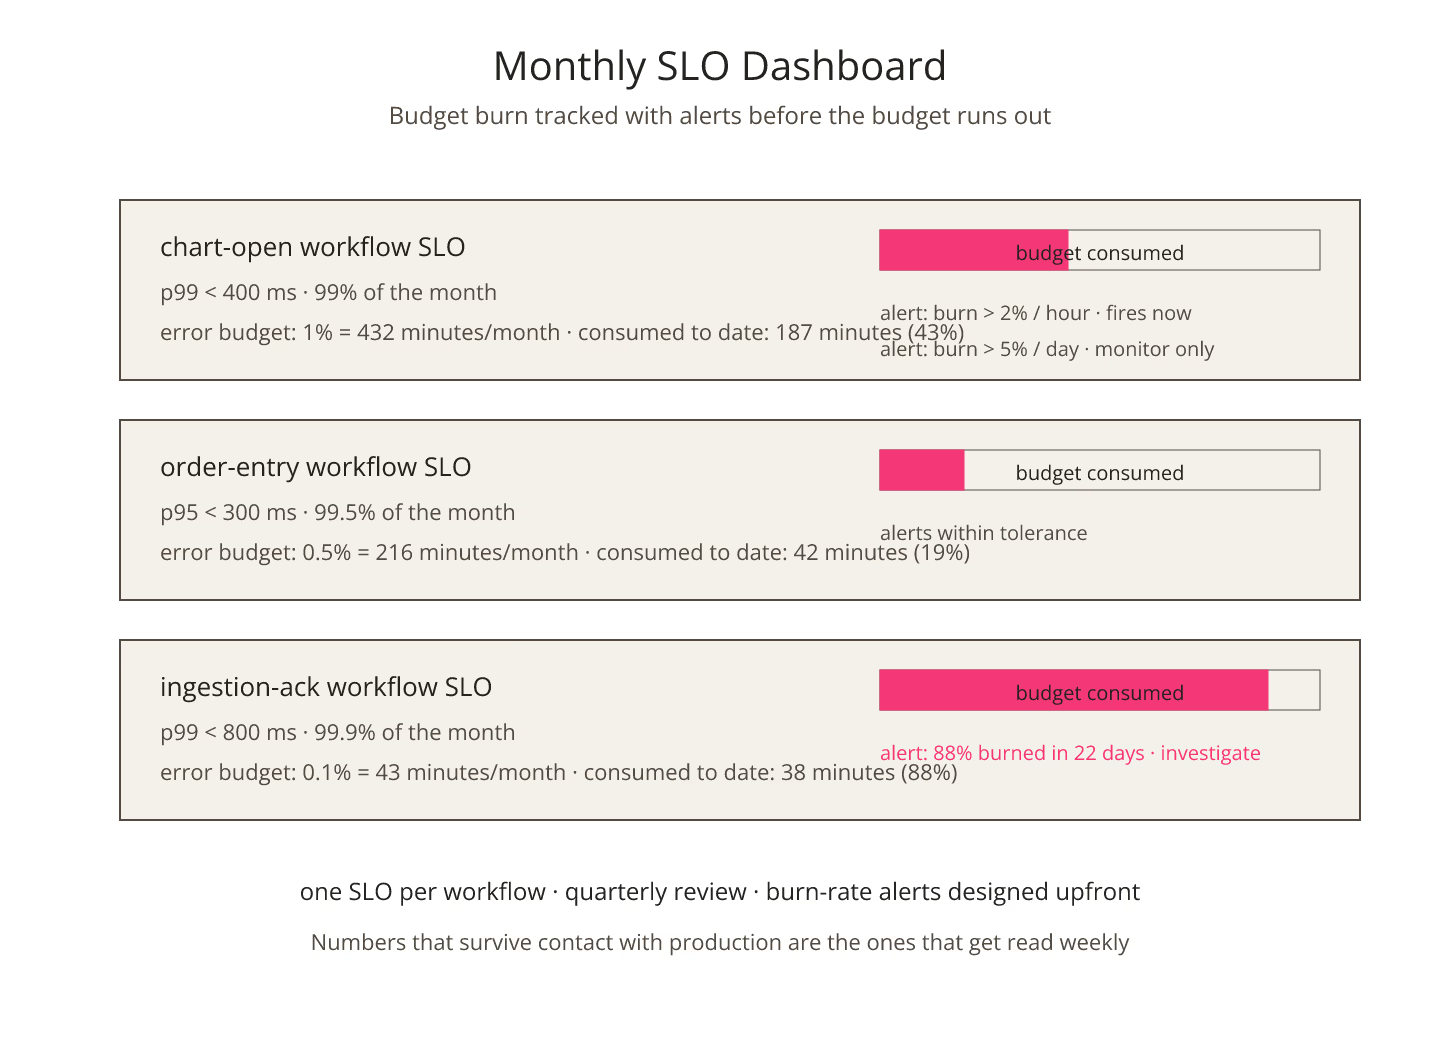
A single SLO across every FHIR endpoint hides the workload shape. The disciplined pattern is to write one SLO per workflow: chart-open latency, order-entry latency, ingestion-ack latency. Each carries its own number and its own defense strategy.
Splits also give operations somewhere concrete to point when an SLO breaks. A missed chart-open SLO is a different incident from a missed ingestion SLO, and the response should differ accordingly.
Own the Error Budget Explicitly
The error budget is the complement of the SLO: if the SLO is ninety-nine percent, the error budget is one percent. That one percent is a real number of allowed slow requests per month. It should be tracked and burned down deliberately.
An error budget that is never referenced is not a budget; it is decoration. Teams that report weekly against the budget make trade-off decisions with numbers in hand. Teams that do not eventually run out silently.
Design the Alert Before the Deployment
Every SLO should carry a burn-rate alert design. The alert fires when the SLO is being consumed faster than the monthly rate allows. Two-window burn-rate alerting (short-window plus long-window) reduces false positives without hiding real regressions.
Alerts written after the SLO tend to be too loud or too quiet. Alerts designed with the SLO stay usable for months.
Include the Network Line Item
An SLO that measures server-side latency only will diverge from user-perceived latency over time. Every workflow-level SLO should either include the network measurement or explicitly name that network is out of scope. For the split, network latency vs server latency in FHIR requests is the accompanying reference.
Revisit Quarterly
Workloads shift. Traffic mixes change. Vendors ship. Latency SLOs that are frozen at deployment slowly go stale. A quarterly review that reads the current numbers, adjusts the targets where necessary, and re-signs the document keeps the SLO alive.
The truth is that SLOs are commitments the team keeps. Numbers that never get revisited are commitments that quietly lapse.
Sources
- Google SRE Workbook chapter on implementing SLOs - Google SRE Workbook chapter on implementing SLOs, canonical reference on latency SLO design